
Nonprofits
See the need, and the overlapping work around it.
A nonprofit can understand a community's need without seeing the other programs, budgets and past interventions in the same place. That is where coordination breaks down.
Also for: GovernmentLibrariesFoundationsResidents
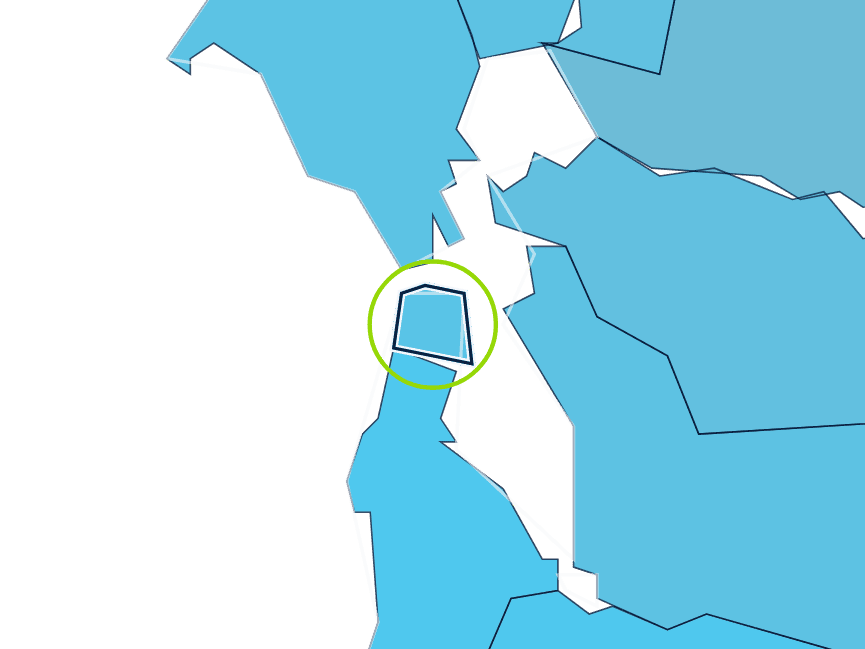
One figure per county. The tracts inside tell a different story. See inside San Francisco County ↓
A nonprofit may understand a community need but not see overlapping programs, budgets, or prior interventions.
From the Civic Intelligence application
Need at service-area scale, with publisher and year.
Where need is high and services are thin.
Partners reading the same map see gaps together.
A real example
One county figure. 197 tracts.
Child poverty in San Francisco County, CA is 8.2% as a whole. Inside it, census tracts run from 0.0% to 62.9%.
0.0% to 62.9%
What exists today
Honest about what is live.
Live means you can use it now. Proposed means designed, not yet built.
- Tract and ZIP Code Area figuresLive nationwide
- Plain-language meaning for every measureLive nationwide
- Commissioned needs studies and filmsLive nationwide
- Overlays from partner service dataProposed
Your next step
A needs and service coverage briefing for your service area
Twenty minutes with the people who build and run the platform, with your place's figures pulled before we talk.
Keep exploring